(3-minute read) |
One of our preferred indicators for US domestic liquidity conditions is the Federal Reserve balance sheet,
minus the Treasury general account, minus reverse repos. S&P 500 (Blue) Fed Balance Sheet – TGA – Reverse Repos (Red)
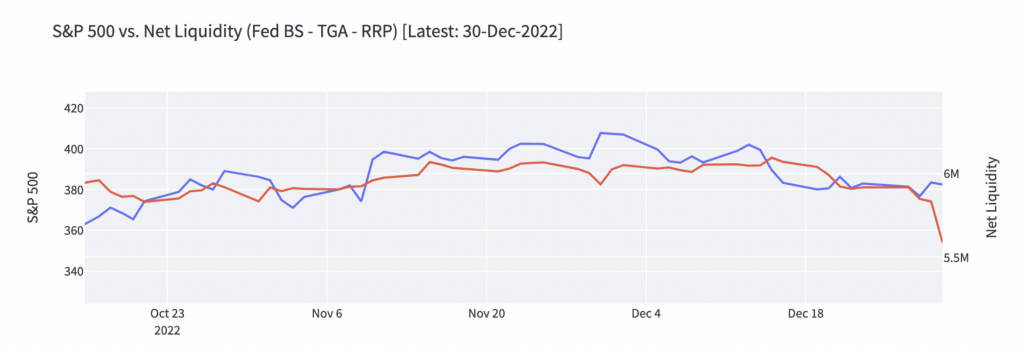
It’s expected to head lower in Q1 2023. As more bonds are issued and the Fed isn’t buying (or is even a net seller like they are now), then that means the private sector has to absorb more of the bond issuance, which crowds out potential equity investment. It’s also generally strong for the dollar, which slows down global growth.
The Fed controls the size of its balance sheet, and the Treasury Department controls the size of the Treasury General Account. When the Fed expands its balance sheet by creating reserves and buying bonds, it is injecting liquidity into financial markets. When it reduces its balance sheet, by being a net seller of bonds and destroyer of reserves, it is removing liquidity from financial markets.
Going forward, the Fed plans to continue draining its balance sheet month after month, as part of their goal of quelling inflation. The Treasury General Account is intended to be flat-but-choppy. Right now, the TGA is $480 billion. They expect to have $700 billion by the end of this quarter (which I doubt they’ll reach, I don’t think they’ll get over $600 billion), and then they expect to get to $500 billion by the end of Q1 2023 (which would be virtually unchanged
from $480 billion).
So, overall, with the Fed continuing to drain liquidity and the Treasury probably being rather neutral, liquidity conditions continue to point downward unless or until something changes, which (at least as one important variable) suggests ongoing unremarkable performance for many risk assets.
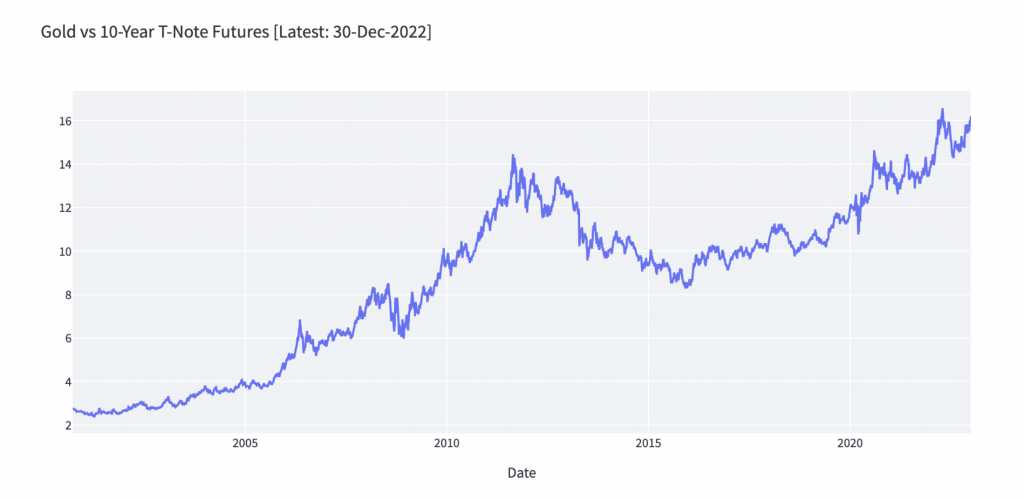
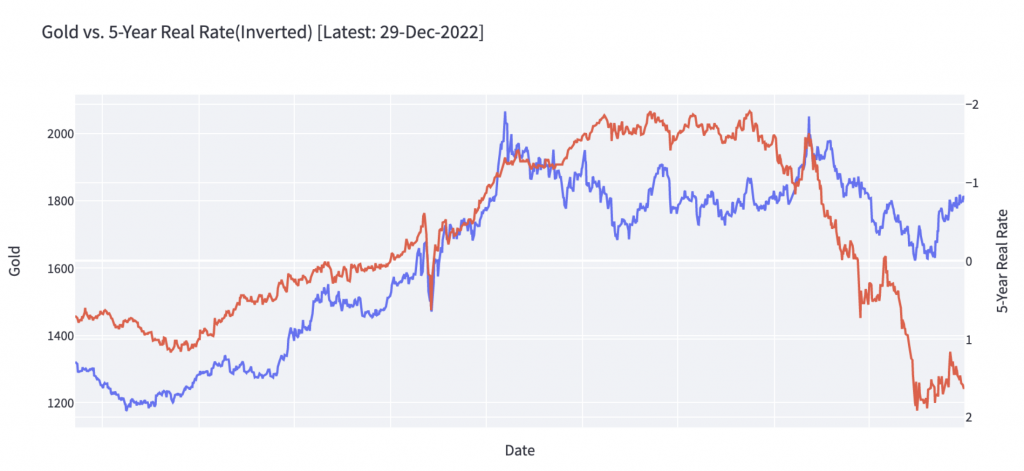
Gold has taken out a decade’s past swing high
and is not making a retest attempt to establish a clear trend. We continue to believe that this is the age of Real Assets, and Gold, as a poster child, will do very well in the time to come.
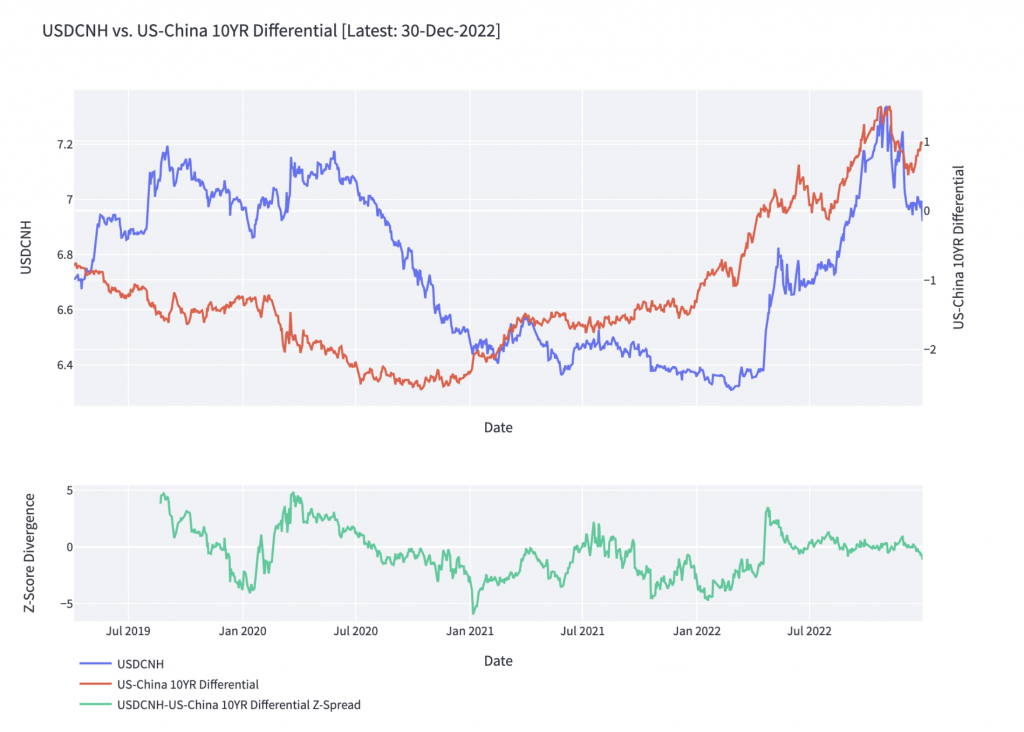
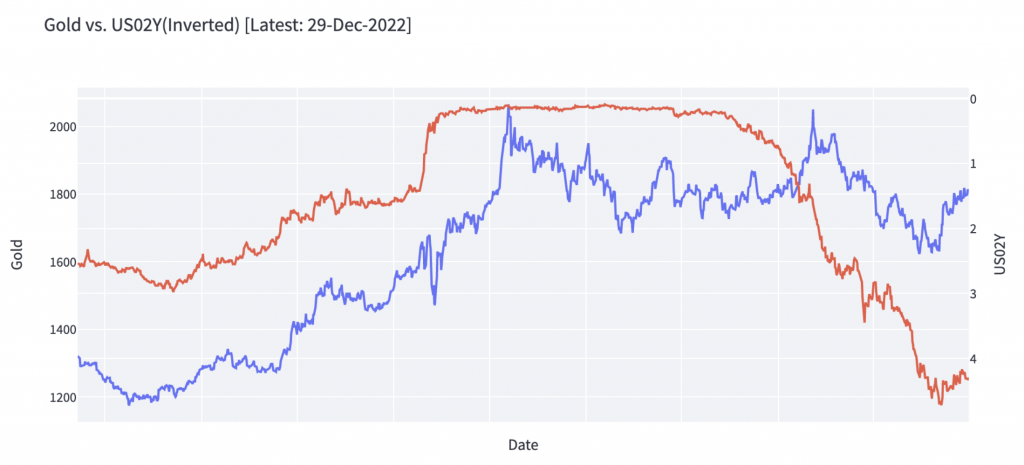
One last hurrah for the Dollar?
Through a tactical lens, 2yr & 5yr Real-Rates (refer to charts below) suggest that the rally in Gold & Silver should be exhausted for a while, allowing space for the Dollar to make another attempt for the highs. This USD/CNH differential relative to US-Chinese yields has been prescient for a large part of 2022, as yields led the move in USD/CNH. China’s reopening has lit a bid under the CNH, and China has yet to clear the Covid infection hurdle for the CNH’s strength to sustain itself. In the meantime, we believe USDCNH will lead the way higher for the USD in the quarter ahead.
We think that USD is the year of peak Dollar, and there will be a time to back up the truck on Gold & Silver.